Wastewater Data Update:

Wastewater data for Santa Cruz County will continue to be collected and reported, but some data may be delayed or unavailable during a transition in sampling programs.

  • Santa Cruz County: Wastewater samples will continue through the Centers for Disease Control and Prevention (CDC) National Wastewater Surveillance System (NWSS).
  • City of Santa Cruz: Wastewater samples will be collected through WastewaterSCAN.
  • Watsonville: Wastewater samples will continue to be collected through CDC NWSS. Until full coverage resumes early 2027, data will be received every other week.

During this transition, weekly updates may not be consistently available, and reporting may be delayed. These changes are due to updates to the CDC NWSS contract and available program resources.

The Respiratory Disease Surveillance webpage contains two resources to help you stay informed about respiratory virus trends and make informed decisions to protect your health and the health of our community throughout respiratory virus season. For a look back on the prior season summary, visit the Respiratory Virus Information webpage.


The Respiratory Virus Dashboard provides up-to-date information on COVID-19, influenza (flu), and respiratory syncytial virus (RSV). The dashboard includes data on wastewater concentrations, hospitalizations, and deaths associated with these respiratory viruses.

Updated *Fridays

The COVID-19 modeling graphs use advanced modeling techniques to project transmission (Rt), infections, and hospitalizations in the next 2-4 weeks in our county.

Updated *Wednesdays

* Update frequency depends on data availability and may be delayed due to holidays or other factors. Recent data are preliminary and subject to change.

Both resources use data from sources including the CDC and the California Department of Public Health (CDPH). For more information about the data sources, methods, and limitations, please see our technical notes.

Together, we can help keep our community healthy and informed. Remember to wash your hands, wear a mask in crowded places, and stay home if you’re feeling sick.

Respiratory Dashboard

This interactive resource helps residents track local trends, spot early warning signs of outbreaks, and understand the seasonal patterns of respiratory viruses. Wastewater surveillance offers a powerful tool to detect rising virus levels before clinical cases surge, while hospitalization and mortality data help guide timely responses by health officials and medical providers.


COVID-19 Modeling

This resource plots and forecasts COVID spread (Rt), hospitalizations, and infections using forecast modeling techniques.

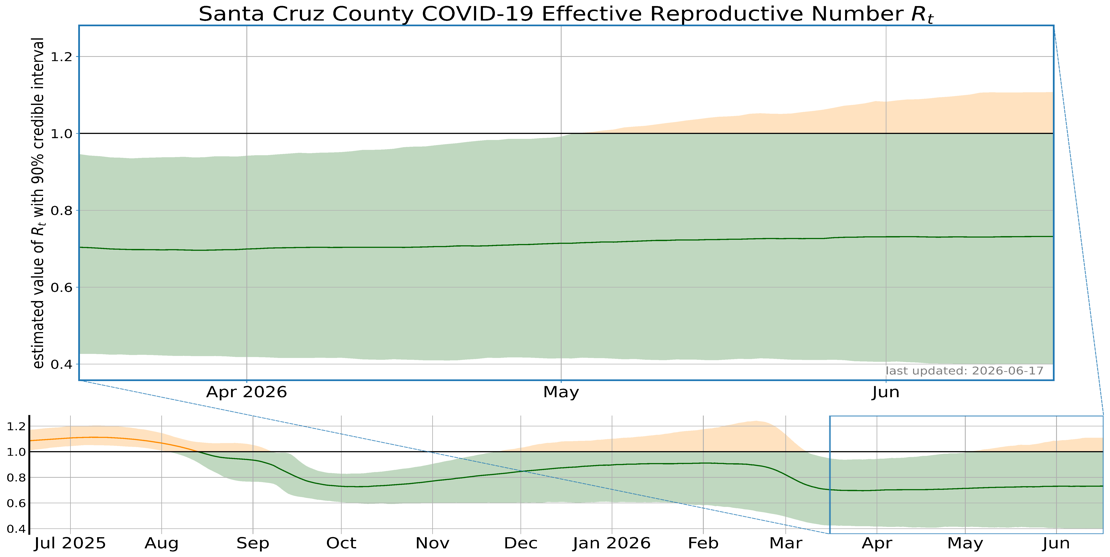
How to read the plot: The plot shows green (for good) when Rt is below 1 and COVID-19 spread is decreasing. When Rt is above 1 and COVID-19 spread is increasing, the plot is yellow (take caution). The darker line shows the most likely Rt in Santa Cruz county. Since models are not perfect, the shaded areas around the darker line show the range of likely Rt values. Please note that case data from the last 7 days are frequently updated and are excluded from the estimation of Rt.

Rt: COVID-19 Spread in Our Community

The Effective Reproductive Number, shown here as “Rt” helps us understand how fast COVID-19 is spreading in our community. For COVID-19, Rt tells us the average number of people who will contract this disease from each infected person.

For example, if Rt equals 1, each existing infection causes one new infection. An Rt equal to 1 means the disease will stay present and stable in our community.

If Rt is less than 1, each existing infection causes less than one new infection. Therefore, if Rt stays below 1, spread of the disease declines and it eventually leaves the community.

When Rt is more than 1, each existing COVID-19 infection causes more than one new infection. The disease will be transmitted between more and more people and the spread of the disease is growing. If Rt stays greater than 1, it can lead to many challenges, including hospitals not being able to care for everyone who gets sick.

Rt depends on people’s behavior, like wearing a mask or keeping social distance. This is why Rt can change over time.

Santa Cruz County COVID-19 Hospitalization Projections

For current information on hospital usage including ICU beds, please visit the California COVID-19 Hospital data page.
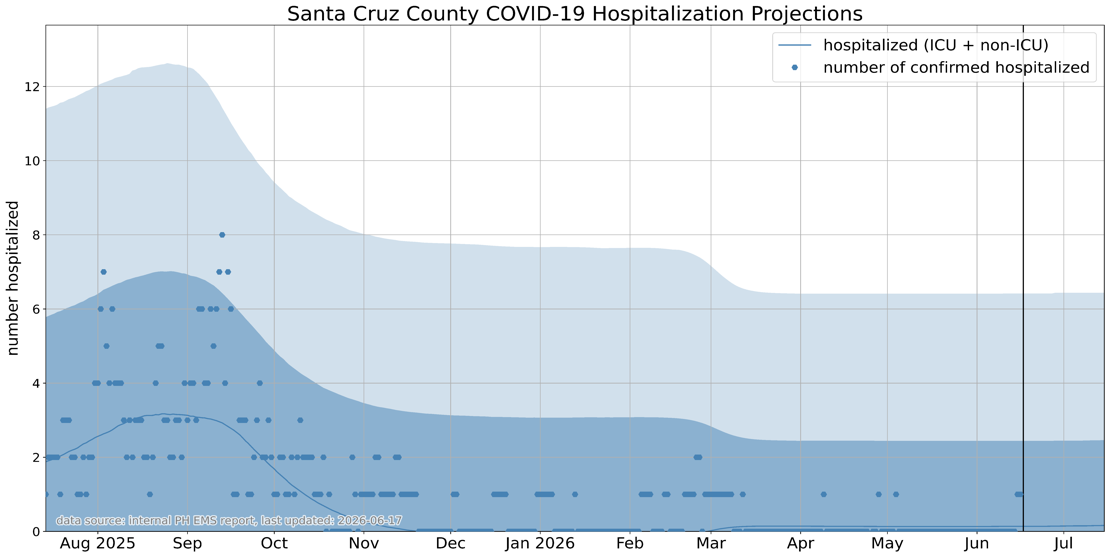
How to read the model: For the actual number of hospitalizations in the past, we use the blue dots. To look at the future, we use the dark blue line and the light blue area. The dark blue line is the most likely number of hospitalizations in the future. Since models are not perfect, the light blue wider area shows the range of likely hospitalizations.

Why We Forecast Hospitalizations

We all rely on our hospitals to take care of us when we are very ill. If a hospital gets too full, it doesn’t have enough space or staff to care for everyone.

So, it is important to keep track of how many people are staying in a hospital at one time. It is also important to use our forecasts to predict when hospitals might get too full.

When our hospitals start to get too full, we need to take actions to slow the spread of COVID-19.

Tracking and forecasting how many people are in our hospitals helps us save lives in our community.

Santa Cruz County COVID-19 Wastewater Projections

How to Read This Model

In order to help calculate the risk of getting a COVID-19 infection, we use this data to predict whether or not viral concentrations are increasing or decreasing.

The red/sienna dots correspond to the actual observed viral levels of COVID-19 detected in Santa Cruz City, Santa Cruz County and Watsonville wastewater collection sites in units of copies per liter with a population weighted average. Weighted averages were used to adjust for changes in population coverage at each wastewater collection sites.  Learn more about wastewater by visiting the CDC's National Wastewater Surveillance System (NWSS) website

Notice the date range on the x-axis (line on the bottom of the graph). The area to the right of the current date are predictions and there are no observations reported in that area. The dark red line is the most likely level of COVID-19 in the wastewater in the future. Since models are not perfect, the light red wider area shows the range of likely virus levels. And the darker shaded area is the more likely range.

The wastewater activity levels “Very Low,” “Low,” “Moderate,” “High,” and “Very High” follow the CDC’s system for tracking virus levels in wastewater. This system converts local wastewater data into a measure called the Wastewater Viral Activity Level (WVAL), which shows how current levels compare to the county’s low viral levels. We calculate this by averaging the wastewater virus concentrations from our three treatment plants (City of Santa Cruz, Santa Cruz County, and Watsonville), weighted by the population each plant serves. Periodically, we update our “low” baseline using the lowest 10% of values from past data. We then compare the current average to that baseline, accounting for normal variation in the data. The results fall into one of five activity levels. To learn more, visit the CDC’s data methods page: cdc.gov/nwss/data-methods.html

SARS-CoV-2 Sewage Monitoring Data

SARS-CoV-2 (the virus that causes COVID-19) is shed in feces by infected individuals and can be measured in wastewater. More cases of COVID-19 in the community are associated with increased levels of SARS-CoV-2 in wastewater, meaning that data from wastewater analysis can be used as an indicator of the level of transmission of COVID-19 in the community.

Wastewater analysis measures the levels of non-infectious RNA (Ribonucleic Acid) in wastewater, not the viable virus. There are no known cases of transmission resulting from exposure to wastewater.

Advantage of Wastewater-Based Epidemiology (WBE)

The use of WBE has several potential advantages:
It includes asymptomatic individuals and people who are unable or unwilling to obtain clinical tests, for a variety of reasons.

It provides a mechanism to monitor the level of community transmission as clinical testing declines, and other, more convenient testing takes place (such as home-based rapid antigen tests) that are not reported to the Public Health Department. Wastewater analysis continues to be a part of our ongoing strategy to monitor the level of community transmission.

Wastewater information is available sooner than information from clinical testing, which means that monitoring SARS-CoV-2 in wastewater can serve as an early indicator of increasing or decreasing COVID-19 infections in the community.

During an increase, this early information could be used to enhance public health messaging in the affected communities to reinforce safe practices, promote more clinical testing, and highlight strategies the public can take to help stop a surge in new cases.
It can help confirm current trends of COVID-19 infections in the community that are based on clinical data.

It can increase confidence that clinical testing results are not biased by availability, time lags, and other factors.

Why We Monitor and Forecast Wastewater Data

Monitoring the concentration of the SARS-CoV-2 (COVID-19) virus in wastewater is a new way to know how much virus is spreading in the community. Wastewater monitoring includes those who haven't been tested. The COVID-19 virus is shed in the feces of infected people, including those who aren't experiencing symptoms. According to scientific research (click HERE to read the research), the viral concentration of COVID-19 in wastewater is highly linked to an increase in cases. When viral concentrations in the wastewater are increasing, then the risk for acquiring a COVID-19 infection from another person is increased.

Technical Notes

For all data sources, update frequency is dependent on data availability from data sources. Most recent data are preliminary and subject to change.

Death Data

Monitoring deaths from COVID-19, flu, and RSV helps us understand how serious these viruses are each season — especially for vulnerable groups like young children, older adults, and people with underlying health conditions. Deaths typically occur weeks after someone becomes seriously ill. As a result, death trends may lag behind trends in cases and hospitalizations. Deaths may continue to increase even after cases and hospitalizations begin to decline.

COVID-19 deaths in Santa Cruz County have dropped significantly since 2021 with the availability of vaccines. Still, tracking deaths remains an important part of understanding the impact of the virus in our community.

The Santa Cruz County Health Services Agency uses death data to monitor the impact of respiratory viruses and inform public health planning and response. Death data are from California Department of Public Health Vital Records and include Santa Cruz County residents who died in or outside the county and had COVID-19, flu, or RSV was listed on the death certificate. This data is updated weekly.

Hospitalization Data

Tracking hospitalizations from COVID-19, flu, and RSV gives us a clear picture of how serious these illnesses are in our community. When more people are hospitalized, it can be an early warning that a virus is spreading more widely or causing more severe illness. This information helps doctors, hospitals, and public health officials act quickly — like preparing hospital resources or issuing public health guidance — to keep our community safe and informed.

We use hospitalization data from two sources:

  • Respiratory Dashboard: Data comes from the Centers for Disease Control and Prevention (CDC) National Healthcare Safety Network (NHSN). The data is updated weekly and typically has a one-week delay between when a hospitalization occurs and when the data become available.
  • COVID-19 Modeling: Data comes from an internal EMS tool used to monitor COVID-19 hospitalizations, ICU patients, and available hospital beds. Data is updated daily.

Hospitalization data includes Watsonville Community Hospital, Dominican Hospital, and Sutter Maternity and Surgery Center.

Wastewater Data

Wastewater surveillance is a useful way to track diseases in a community. When people are infected, small amounts of viruses or bacteria, such as COVID-19, flu, or norovirus, can enter the sewage system through human waste. By collecting and testing wastewater, public health experts can track changes in virus levels in the community—sometimes before people feel sick or seek medical care. Because virus levels in wastewater can rise before more people become sick or hospitalized, this can provide an early warning of increased disease activity and help health officials respond. It also allows us to monitor large groups of people without requiring everyone to be tested. Wastewater samples are collected a few times a week from the City of Santa Cruz, County, and Watsonville Wastewater Treatment Plants and the wastewater concentration plots are updated weekly.

Current data sources:

Collected by: Program: Downloaded from:
Santa Cruz City Treatment Plant WastewaterSCAN CDPH’s internal wastewater team
Santa Cruz County Treatment Plant National Wastewater Surveillance System (NWSS)
Watsonville Treatment Plant National Wastewater Surveillance System (NWSS)

We use wastewater data in two ways:

  • Respiratory Dashboard: The data points included on the wastewater plot correspond to a 10-day rolling average concentration of virus for each respective wastewater treatment plant. The concentrations are “normalized” by the concentration of a plant virus that is harmless to humans but is shed in stool. This plant virus is the pepper mild mottle virus, or PMMoV. Normalizing by PMMoV adjusts for changes in the amount of feces in the sample and the efficiency of the procedures from day to day.
  • COVID-19 Modeling: We use the population weighted average of the raw wastewater concentration of all three plants, if available (City of Santa Cruz, Santa Cruz County, and Watsonville).